Heikin-Ashi Trend
Heikin-Ashi is a special type of candlestick chart that smooths out price movements, making it easier to spot trends. It doesn’t show exact prices — instead, it averages them to reduce noise and highlight direction.
A series of green candles usually means the stock is trending up, while a string of red candles suggests it’s trending down. These charts help you stay focused on the bigger picture instead of short-term spikes.
- Smoother Trends: Heikin-Ashi uses averaged values to highlight consistent movement.
- Trend Clarity: Several green candles in a row often signal strength in an uptrend.
- Wicks (Shadows): In strong uptrends, you’ll often see no lower shadows — a good sign for momentum.
- Note: These charts hide some price gaps and exact open/close levels, so they’re better for spotting trends than pinpointing entry/exit prices.
At ApexTrend, we track this pattern when three or more green Heikin-Ashi candles appear above key support levels like EMA lines. Our system then scores the trend strength using AI and historical trade data.
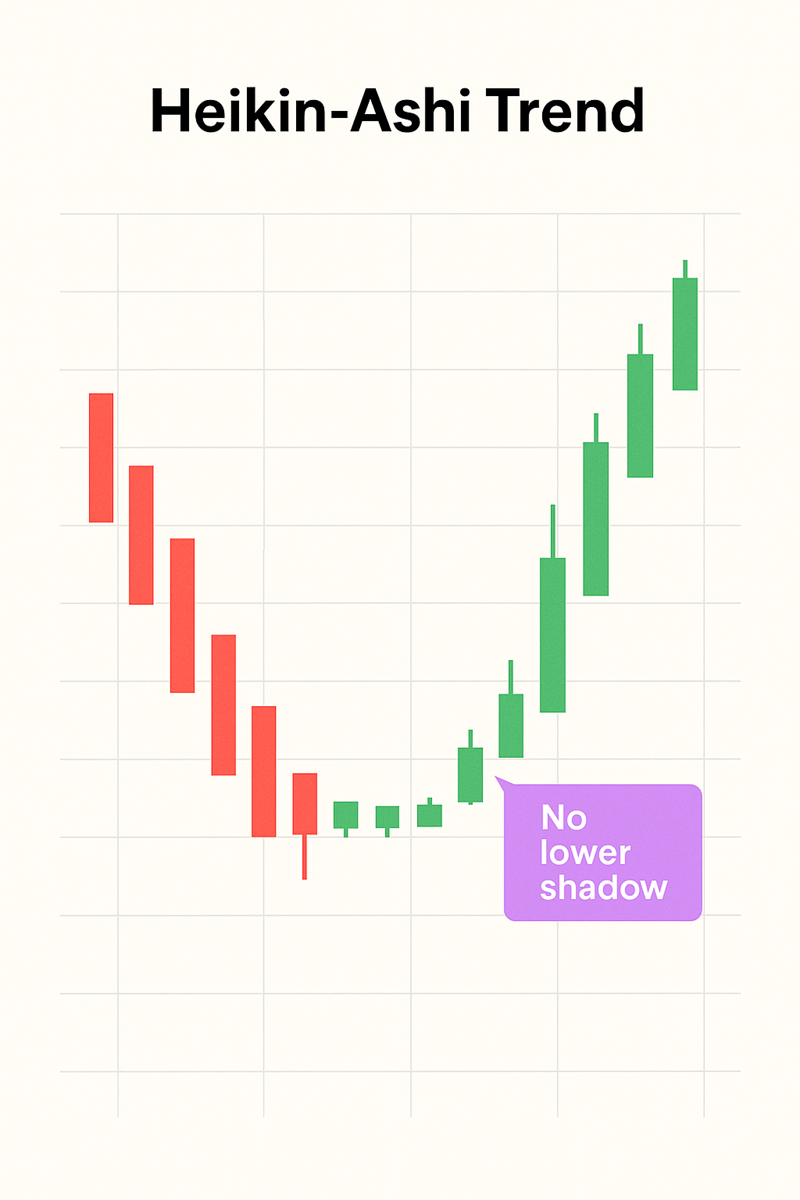
When we detect a run of green Heikin-Ashi candles with no lower wicks, it often means the stock is in a strong uptrend — a signal we flag in real time.